
How a copy account loses money
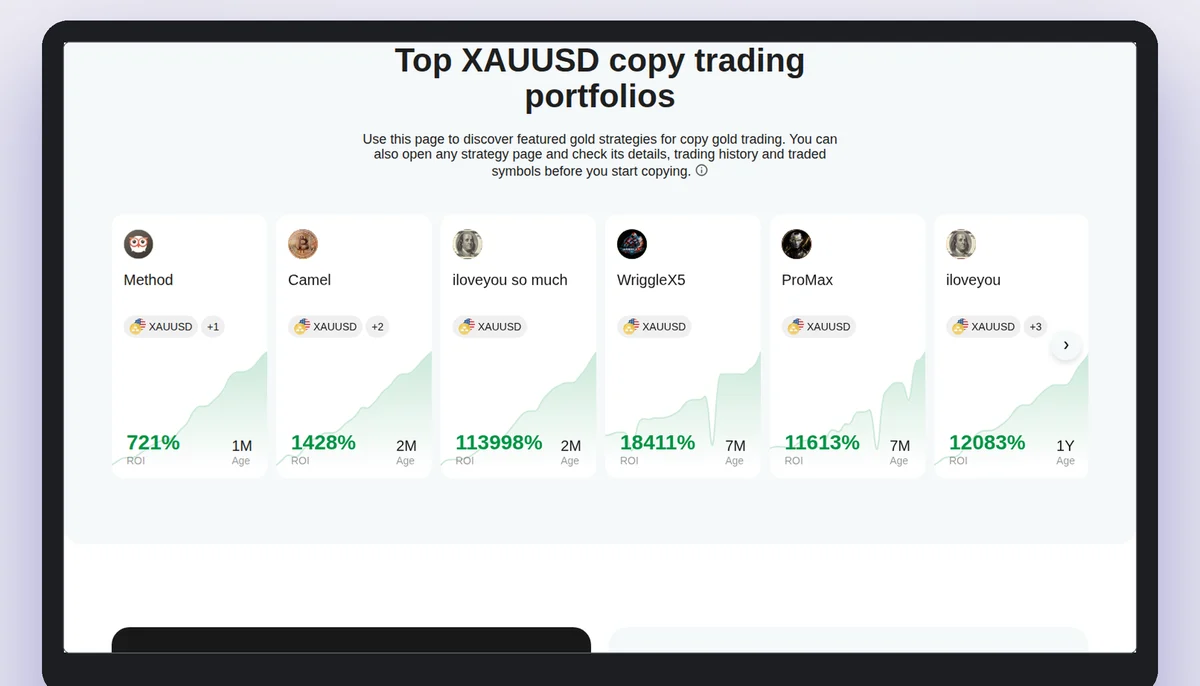
A strategy card prints a return and draws a small curve beside it. This page puts the two side by side for the 20 cards cTrader's symbol pages showed on 6 November 2026, and explains, from the help pages, the mechanics through which a follower's account can lose money. It ranks nothing and names no provider.
Two numbers on one card
Each card prints a return figure, shown beside the strategy's age. The pages do not state the period of that figure on the card; the help page for the strategy page speaks of an "all time ROI" at the top of each strategy page, and this site does not claim the card figure is that one. Beside it is a small curve of 29 daily points. The two are different measurements, and the cards show it.
Where the 20 curves ended
Each strategy card on cTrader's gold, bitcoin and euro pages draws a small curve. The series behind it has 29 daily points, from 8 October 2026 to 5 November 2026, and starts at 0. The table counts the last point of each curve. The same 20 cards appear on the three pages. Source: ctrader.com/copy/symbols/xauusd, /btcusd, /eurusd, read on 6 November 2026.
| Last point of the curve | Number of cards |
|---|---|
| Ended below zero | 5 |
| Ended between 0 and 10 | 5 |
| Ended between 10 and 50 | 7 |
| Ended above 50 | 3 |
What the counts show, and what they do not
Of the 20 curves, 5 ended below zero and 15 ended above it. The lowest last point was -13.66 and the highest was +245.28. Meanwhile the printed returns run from -17% to 113,998%, and 8 of the 20 printed returns are 1,000% or more. A curve of 29 days is a short stretch. This site draws no conclusion about any strategy from it; the point is that a large printed return and a curve that ends below zero stand on the same page.
The largest fall inside the 29 points
For each curve, the largest drop from a higher earlier point to a lower later one, in the curve's own unit (percentage points). Counted here from the same series. Source: as above, read on 6 November 2026.
| Largest fall within the curve | Number of cards |
|---|---|
| No fall from an earlier peak | 6 |
| A fall of up to 5 points | 9 |
| A fall of 5 to 10 points | 1 |
| A fall of more than 10 points | 4 |
Falls inside the window
4 of the 20 curves fell by more than 10 points from an earlier high within the 29 days; the largest single fall was -36.79 points. 6 curves had no fall at all in the window, which with 29 points only says that every day was at or above the one before. A fall is measured on the provider's account. A follower with a smaller account, lower leverage or a later entry would see a different path.
How leverage turns a price move into an account move
A contract for difference is a leveraged product. The account holds a margin, a fraction of the position's value, and the position moves with the whole value. cTrader's list prints a maximum leverage for each broker; for FxPro it printed 1:30, and of the 24 copy-flagged brokers 3 printed 1:30 and 18 printed 1:500 or more. The higher the leverage actually used, the smaller the price move that wipes out the margin. That is arithmetic, not a forecast.
Margin, stop out and the lower-leverage follower
The help page warns that a follower whose leverage is lower than the provider's may not have enough margin to copy every trade and may reach stop out earlier. At stop out the broker closes positions. The follower's account then ends smaller, whatever the provider's account does next.
The brakes and their limits
The follower can set an equity stop loss, add or remove funds, or stop copying. The help page states that an equity stop loss is not a guaranteed stop-out price. When copying stops, copied positions are closed and fees due are charged. A follower who stops after a fall has realised the fall.
A printed return is not a forecast
cTrader's own page on copying says: "Past performance is not a reliable indicator of future results." and that copy trading "involves significant risk and may not be suitable for all users". This site repeats those sentences because they are the platform's, and adds none of its own about what any strategy will do.
In brief
Read next
Questions about copy costs and risk
Does a high printed return mean the strategy is safe?
No page read says so. On 6 November 2026 the cards with the largest printed returns were not the ones with the highest curve ends; this site draws no inference from that.
Is 29 days enough to judge a strategy?
No judgement is offered here. It is the window the cards draw, and the table only counts what it shows.
Can a follower lose more than the strategy's own drop?
The help pages describe lower leverage, price differences and fees as reasons the follower's result can differ from the provider's.
Who bears the loss?
The follower. A copied trade runs on the follower's account.
The broker this site links to
This site links to FxPro, which cTrader's list marks as a copy-enabled broker. A copied trade is a leveraged contract on a price, not ownership of anything. Read the terms before you decide anything.